| Code | Explanation |
|---|
${point.x} | Represents the current X value |
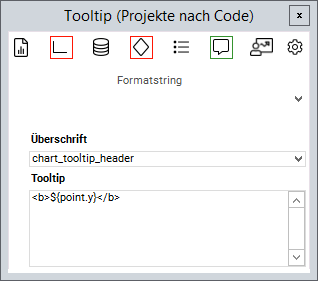
${point.y} | Represents the current Y value |
${point.text} | Represents the current Text value |
${point.percentage}% | Represents the current percentage value |
${series.name} | Represents the current Name value |
<b>...</b>
| Formats a text in bold font |
<i>...</i>
| Formats a text in italic font |
<br />
| Inserts a line break |