Customizing
Version 27 Version 26 39.5.25 39.5.23 39.5.22 39.5.21 39.5.20 39.5.19 39.5.18 39.5.17 German English

Tips, Rules, and Examples for Chart Customizing

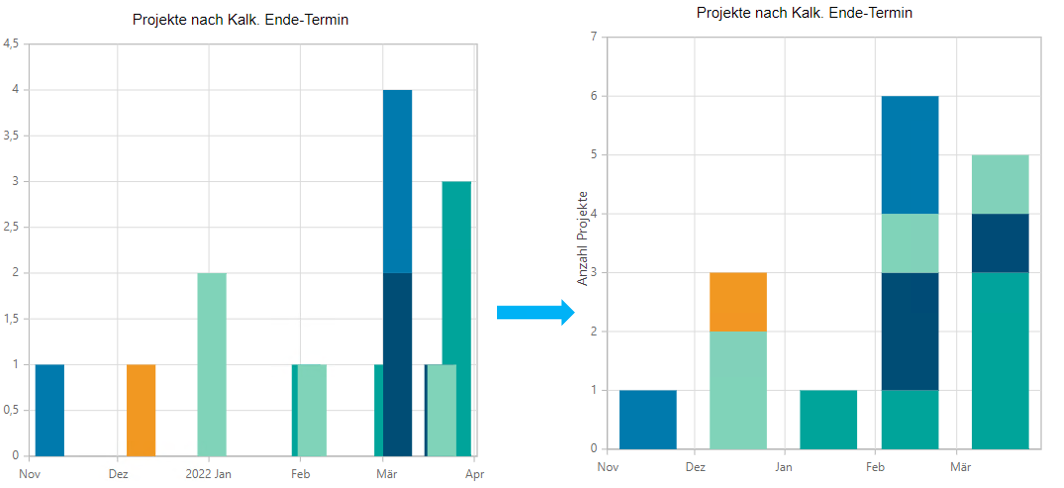
Stack Date Values per Month

Objective

  • If you want to build a stacked chart with date values and stack them per month but the date values are not on the same day, the data points are not stacked.

Solution

  • Open axis customizing

    • X-axis (DateTime)

      • IntervalType = "Months" – only show months on the x-axis

      • LabelFormat = "MMM" – only show month abbreviation as labels

      • RoundToIntervalType = "true" – round date values to beginning of the month

BalkenDarstellung.png

The ticks on the axis are the end of a month, not the beginning of the next one.

Column and Bar Charts with Multiple Data Series

Objective

  • In column and Gantt charts, a separate area is reserved for each data series for the X or Y value. For example, if there are 3 data series and 3 X values, each data series receives 1/3 of the space per X value.

  • If grouping is enabled, multiple data series are also created, and the same problem occurs.

Solution

  • The Data Series Grouping parameter can be used to combine multiple data series on the same X value.

Applies only to versions prior to Web release 3.1.0; as of this release, grouping is no longer required.

Examples

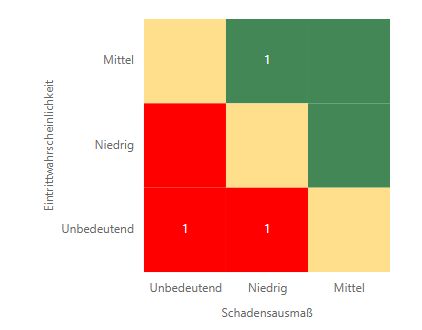
JSON settings for risk charts

Objective

  • JSON settings for a risk chart with a legend and labeled x- and y-axes.

Solution

Chart Settings:
JSON
{
    "Chart": {
        "Type": "Risk",
        "Title": "@chart_project_by_risk"
    },
    "Legend": {
        "Enabled": "true",
        "Position": "Auto"
    },
    "YAxis": {
        "Labels": [
            "@chart_label_project_by_risk_low",
            "@chart_label_project_by_risk_medium",
            "@chart_label_project_by_risk_high"
        ],
        "Title": "@chart_label_project_by_risk_chance"
    },
    "XAxis": {
        "Labels": [
            "@chart_label_project_by_risk_low",
            "@chart_label_project_by_risk_medium",
            "@chart_label_project_by_risk_high"
        ],
        "Title": "@chart_label_project_by_risk_damage"
    },
    "Serieses": {
        "SeriesSet": [
            {
                "Series": {
                    "Text": "amount",
                    "ActionDF": "chart_action",
                    "Area": "source_project_by_risk_grouped",
                    "XValue": "dmg_dimension",
                    "YValue": "probability"
                }
            }
        ]
    }
}

Example

default_risk_chart.png


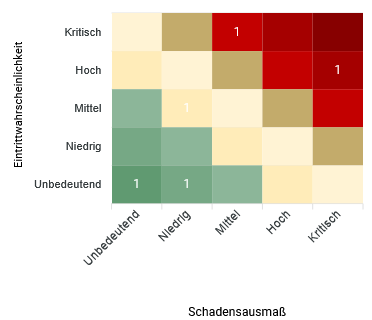
Risk Charts with Several Dimensions

Objective

  • JSON configuration for a risk chart with more than three dimensions. The default colors can be overridden with the ColorPalette parameter; in this case, the colors are distributed approximately evenly across the entire chart.

Solution

Chart Settings:
JSON
{
    "Chart": {
        "Type": "Risk"
    },
    "Serieses": {
        "Marker": {
            "Enabled": "false"
        },
        "SeriesSet": [
            {
                "Series": {
                    "Text": "counter",
                    "Area": "chart_risks_grouped",
                    "InitiallyVisible": "true",
                    "XValue": "dmg_dimension",
                    "YValue": "probability"
                }
            }
        ]
    },
    "XAxis": {
        "Type": "Category",
        "Labels": [
            "$Unbedeutend",
            "$Niedrig",
            "$Mittel",
            "$Hoch",
            "$Kritisch"
        ],
        "Title": "@chart_x_title"
    },
    "YAxis": {
        "Type": "Category",
        "Labels": [
            "$Unbedeutend",
            "$Niedrig",
            "$Mittel",
            "$Hoch",
            "$Kritisch"
        ],
        "Title": "@chart_y_title"
    }
}

Example

risk_chart_more_dimensions.png


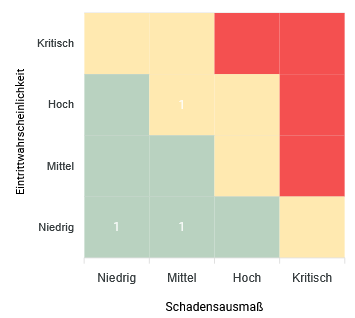
Risk charts with color matrix

Objective

  • JSON configuration for a risk chart with particular color areas that are set via the ColorMatrix parameter.

    • This allows fixed colors to be defined for specific risk areas.

Chart Settings:
JSON
{
    "Chart": {
        "Type": "Risk"
    },
    "Serieses": {
        "Marker": {
            "Enabled": "false"
        },
        "SeriesSet": [
            {
                "Series": {
                    "Text": "counter",
                    "Area": "chart_risks_grouped",
                    "InitiallyVisible": "true",
                    "XValue": "dmg_dimension",
                    "YValue": "probability"
                }
            }
        ]
    },
    "Heatmap": {
        "ColorMatrix": [[ 1, 1, 2, 2], [0, 1, 1, 2], [0, 0, 1, 2], [0, 0, 0, 1]],
        "ColorRanges": [
            { "From": 0, "To": 0, "Color": "#438757" },
            { "From": 1, "To": 1, "Color": "#ffdf8c" },
            { "From": 2, "To": 2, "Color": "#ef0000" }
        ]
    },
    "XAxis": {
        "Type": "Category",
        "Labels": [
            "$Niedrig",
            "$Mittel",
            "$Hoch",
            "$Kritisch"
        ],
        "Title": "@chart_x_title"
    },
    "YAxis": {
        "Type": "Category",
        "Labels": [
            "$Niedrig",
            "$Mittel",
            "$Hoch",
            "$Kritisch"
        ],
        "Title": "@chart_y_title"
    }
}

Example

risk_fixed_colors.png

Process Chart

Objective

  • JSON configuration for a process chart for displaying project phases. Every step displays the phase name (XValue) above the timeline and is marked as the current phase via Yvalue (Boolean).

    • Steps before the current phase are displayed as completed, the current step as active, the following as pending.

Chart Settings:
JSON
{
    "Chart": {
        "Type": "Process",
        "Title": "@chart_process_phase"
    },
    "Serieses": {
        "SeriesSet": [
            {
                "Series": {
                    "Area": "source_process_phase",
                    "XValue": "phase_name",
                    "YValue": "phase_is_current_pr_phase",
                    "InitiallyVisible": "true"
                }
            }
        ]
    }
}

Process Chart with Status Text per Step

Objective

  • If the Text parameter is set for a data series, a second row appears beneath every step.

    • Completed steps show a checkmark followed by the value of the Text data field; typically a date such as 12.11.24.

    • The active step is marked with the status “In Progress”.

    • Pending steps show the “Pending” status.

  • If there is no value set for the Text data field, the status bar is completely hidden.

Chart Settings:
JSON
{
    "Chart": {
        "Type": "Process",
        "Title": "@chart_process_phase"
    },
    "Serieses": {
        "SeriesSet": [
            {
                "Series": {
                    "Area": "source_process_phase",
                    "XValue": "phase_name",
                    "YValue": "phase_is_current_pr_phase",
                    "Text": "phase_completion_date",
                    "InitiallyVisible": "true"
                }
            }
        ]
    }
}

Data Field Matrix Chart

Objective

  • JSON settings for a data field matrix chart for displaying data field values; e. g. resource avatars; in a matrix of X and Y categories.

Chart Settings:
JSON
{
    "Chart": {
        "Type": "DataFieldMatrix"
    },
    "Serieses": {
        "Marker": {
            "Enabled": "false"
        },
        "SeriesSet": [
            {
                "Series": {
                    "ImageDf": "avatar",
                    "Area": "image_source",
                    "XValue": "influence_id",
                    "YValue": "interest_id"
                }
            }
        ]
    },
    "XAxis": {
        "Type": "Category",
        "Labels": [
            "$niedrig",
            "$mittel",
            "$hoch"
        ],
        "Title": "$Einfluss"
    },
    "YAxis": {
        "Type": "Category",
        "Labels": [
            "$niedrig",
            "$mittel",
            "$hoch"
        ],
        "Title": "$Interesse"
    }
}

Milestone Chart with Past Date Colors

Objective

  • For the PastDatesColor parameter to take effect on a date-time Y-axis, the parameter must be set on the Y-axis object; the value on the X-axis is ignored in this case.

    • In this case, the RangePadding parameter must also be set on the Y-axis.