
General
Information
-
Profiling serves to find bottlenecks in the code.
-
By means of the profiling data you can easily determine which positions must be optimized in order to compare optimizations with a more accurate tool like
Timeit
.
-
See the following excerpt from the profile.py Dokumentation:
-
Call count statistics can be used to identify bugs in code (surprising counts), and to identify possible inline-expansion points (high call counts). Internal time statistics can be used to identify “hot loops” that should be carefully optimized. Cumulative time statistics should be used to identify high level errors in the selection of algorithms.
Within PLANTA
-
The profiler can measure which Python functions are run when interacting with a field.
-
If the R39 total (CU) menu items are assigned to the user and the Customizer rights DI is activated for the user, the function can be accessed under Tools or via the F10 shortcut.
Application
-
Click on an input field in order to focus it.
-
Press F10
-
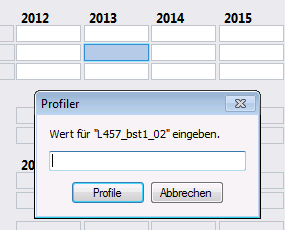
Depending on the DF behavior of the field, either the profiling, or a dialog message requiring input will be displayed.
|
|
Field with DF behavior i |
-
If input is required, the effect of the value entered in the field is analyzed.
-
For fields which only require one click, like buttons or links, a click is simply simulated.
-
After the profiling has been completed, a dialog message will be displayed again, providing multiple options for the evaluation of the profiling result.
|
Button |
Function |
|---|---|
|
Quick Analysis |
The result will be displayed directly in a MessageBox |
|
Generate file |
Save the result as a file |
|
Cancel |
Discard result |
Quick Analysis
-
The quick analysis provides customizers with a fast interface for analyzing problematic positions in the code.
-
For complex problems, we recommend that you save a profile file for each version and analyze the results in an external tool (e.g. in RunSnakeRun or with the standard Python Module).
Details
-
In order for the message box not to become too large, the number of lines displayed per display mode is limited as follows:
|
Mode |
Limitation |
|---|---|
|
Normal |
25 lines |
|
Callers |
15 lines |
|
Callees |
15 lines |
-
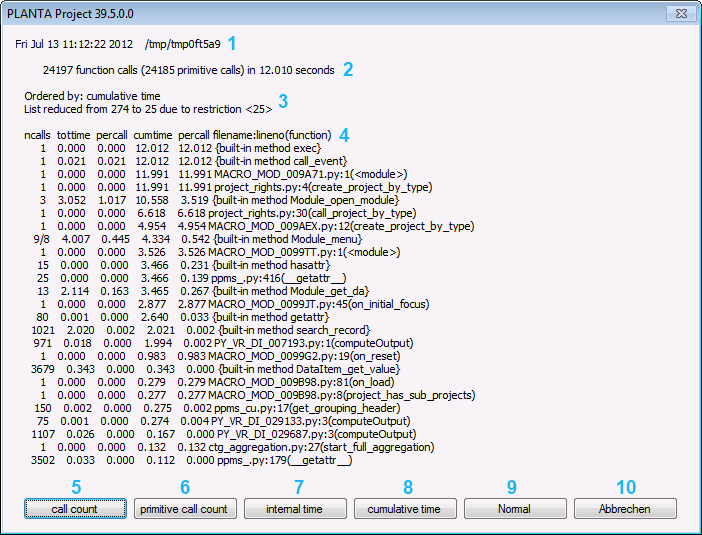
The message box is structured as follows:
|
Number |
Explanation |
|---|---|
|
1 |
Time of analysis and path of profile file. During quick analysis, the file is always located in a temporary directory |
|
2 |
The number of function calls with recursion, without recursion, and the total duration |
|
3 |
Subject of sorting and amount of display |
|
4 |
The profile table |
|
5, 6, 7, 8 |
Sort by the corresponding column |
|
9 |
Switch between the Normal, Callers, and Callees views |
|
10 |
Cancel display and close the MessageBox |
-
The columns describe the following:
|
Column |
Explanation |
|---|---|
|
ncalls |
Separate the number of calls and the number of recursive calls by a slash. |
|
tottime |
Total time spent in this function without subfunction calls |
|
percall |
tottime/ncalls |
|
cumtime |
Time spent within the function from call to closure, including all subfunctions |
|
percall |
cumtime/ncalls |
|
filename:lineno(function) |
Name of the file: Line number (function name) |
-
The different views:
|
View |
Meaning |
|---|---|
|
Normal |
Shows function calls with values for the columns specified above |
|
Callers |
Shows, what called a function as well as ncalls, tottime, and cumtime |
|
Callees |
Shows, which subfunctions of a function have been opened as well as the same columns as in the Callers view |
Example
-
The following Macro has been profiled:
from ppms import ppms

projects = [item for sublist in ppms.db_select("SELECT DI001001 FROM DT461") for item in sublist]

for project in projects:
    project_rec = ppms.search_record(461, [project], [1001], True)
-
Excerpt from the result, sorted by Call Count:
ncalls  tottime  percall  cumtime  percall
      209    0.573    0.003    0.573    0.003 {built-in method search_record}
       11    0.000    0.000    0.000    0.000 ppms_.
        2    0.007    0.004    0.007    0.004 {built-in method db_select}
Details
-
You can see that
search_record209 was called, which took 0.573 seconds. -
db_selectwas called twice, which seems strange here since the macro callsdb_selectonly once. -
By clicking on the Normal button you can switch to another view.
-
The same profile, viewed from the Callers perspective:
Function                                   was called by...
                                               ncalls  tottime  cumtime
{built-in method search_record}            <-       4    0.003    0.003  MACRO_MOD_009ATM.py:1(<module>)
                                                  204    0.569    0.569  MACRO_MOD_009BQX.py:1(<module>)
                                                    1    0.000    0.000  ppms_cu.
{built-in method db_select}                <-       1    0.006    0.006  MACRO_MOD_009BQX.py:1(<module>)
                                                    1    0.001    0.001  ppms_cu.
ppms_cu.        <-       1    0.000    0.016  MACRO_MOD_009ATM.py:1(<module>)
Notes
-
009BQX is the macro module.
-
009ATM is the macro behind the button in 00855 Module, which opens the selected module.
Details
-
You can see that
db_selecthas actually been opened by the module once only.-
However, the macro, which is behind the module call button, had to initiate a database request directly as well since it uses the
get_global_settingfromppms_cumethod.
-