Information
-
The following tutorial provides basic knowledge on Customize Charts which can be used to create and adjust charts in PLANTA project.
-
Technical knowledge on PLANTA customizer is provided, a.o., in the Tutorial: Module Customizing (Level 1).
-
The screenshots used in this tutorial are mere examples of functions and their layout may deviate from the actual layout in the program.
Requirements
-
Basic requirements for carrying out this workflow are a substantial knowledge of the PLANTA software as well as of its structure, operation, and operating principles. For information on this, please refer to the Introduction and Operation help area:
Build Pie Chart (Projects by Code)
Objective
-
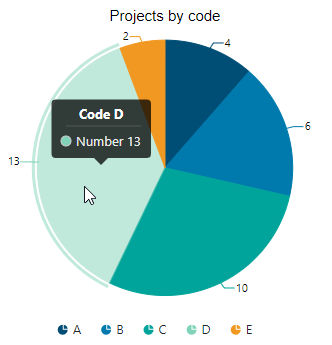
To create a chart which represents the number of projects per project code in a pie chart.
Create Module
Objective
-
Create the module in which you want to create the chart.
Procedure
-
Log in with user P20.
-
Create a module which meets the following requirements:
-
The module contains a chart data area with a Button/IronPython data field with "ch" DF behavior on which the chart is created.
-
The module contains two source data areas:
-
The upper data area is a grouping area and contains
-
a DI by which projects are grouped (in this case the project code)
-
a virtual DI for determining the number of projects per project code and for mapping them
-
a button DI with an action module (in this case for filtering the chart by project code)
-
-
The lower data area contains the same Dis as the upper area and additional DIs for selecting (filtering) projects.
-
-
For this tutorial you can also use the already existing example module 009DK5.
Create New Chart
Objective
-
Create a chart on the data field of the chart area and configure it as a pie chart.
Procedure
-
Start the module in which you want to create the chart by clicking on

-
Click on the Start chart customizing button to open the chart customizer.
-
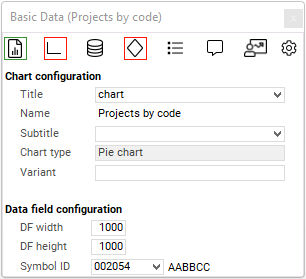
Select the "Pie chart" chart type in the Select Chart Type module.
-
The chart customizer can be opened via the Basic Data module..
-
Select the Python ID of the data field from the chart area in the Title field.
-
Save.
Configure Chart
Objective
-
Configure the chart in a way that the following data is displayed:
-
Number of projects per project code
-
The segment colors correspond to the colors of the project code
-
When you click on a segment an action is carried out
-
In our example, the chart is filtered by project code.
-
-
Procedure
-
Switch to the Data Series module by clicking on the

-
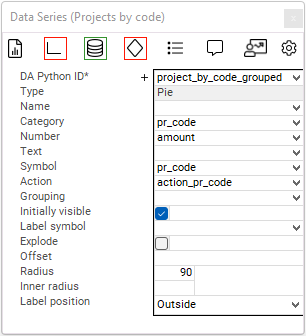
Configure the chart as follows:
-
DA Python ID:
project_by_code_grouped-
The grouped data area is selected as source of the data series.
-
-
Category:
pr_code-
The project code is defined as category of the circle segments.
-
-
Number:
amount-
The summed up number is defined as share of the circle segments.
-
-
Symbol:
pr_code-
The symbol which is applied to the project code data field is defined as symbol for the circle segments.
-
-
Action:
action_pr_code-
The button from the source is triggered when you click on a segment.
-
-
Label Position:
Outside-
The number specification is displayed outside the chart.
-
-
Save.
Configure Tooltip
Objective
-
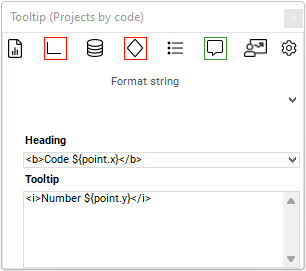
To have individual tooltips displayed in the chart.
Procedure
-
Switch to the Tooltip module by clicking on the

-
Enter
<b>Code ${point.x}</b>as a value in the Heading field. -
Enter
<i>Anzahl ${point.y}</i>as a value in the Tooltip field. -
Save.
Result: