Tutorial: Chart Customizing
Information
The following tutorial provides basic knowledge on Customize Charts which can be used to create and adjust charts in PLANTA project.
Technical knowledge on PLANTA customizer is provided, a.o., in the Tutorial: Module Customizing (Level 1).
The screenshots used in this tutorial are mere examples of functions and their layout may deviate from the actual layout in the program.
Requirements
Basic requirements for carrying out this workflow are a substantial knowledge of the PLANTA software as well as of its structure, operation, and operating principles. For information on this, please refer to the Introduction and Operation help area:
Build Pie Chart (Projects by Code)
Objective
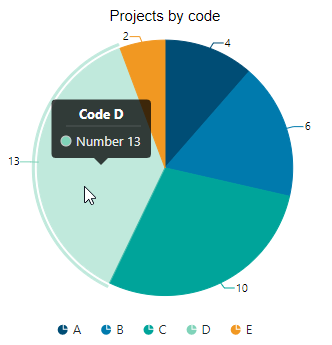
To create a chart which represents the number of projects per project code in a pie chart.
Create Module
Objective
Create the module in which you want to create the chart.
Procedure
Log in with user P20.
Create a module which meets the following requirements:
The module contains a chart data area with a Button/IronPython data field with "ch" DF behavior on which the chart is created.
The module contains two source data areas:
The upper data area is a grouping area and contains
a DI by which projects are grouped (in this case the project code)
a virtual DI for determining the number of projects per project code and for mapping them
a button DI with an action module (in this case for filtering the chart by project code)
The lower data area contains the same Dis as the upper area and additional DIs for selecting (filtering) projects.
For this tutorial you can also use the already existing example module 009DK5.
Create New Chart
Objective
Create a chart on the data field of the chart area and configure it as a pie chart.
Procedure
Start the module in which you want to create the chart by clicking on
 .
.Click on the Start chart customizing button to open the chart customizer.
Select the "Pie chart" chart type in the Select Chart Type module.
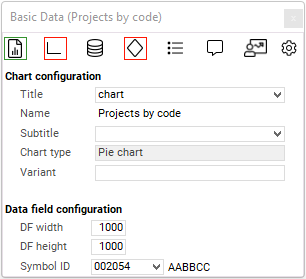
The chart customizer can be opened via the Basic Data module..
Select the Python ID of the data field from the chart area in the Title field.
Save.

Configure Chart
Objective
Configure the chart in a way that the following data is displayed:
Number of projects per project code
The segment colors correspond to the colors of the project code
When you click on a segment an action is carried out
In our example, the chart is filtered by project code.
Procedure
Switch to the Data Series module by clicking on the
 icon.
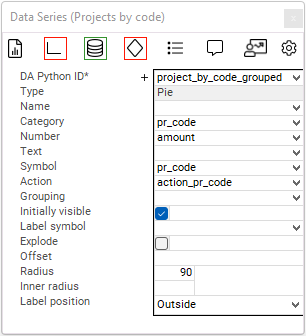
icon.Configure the chart as follows:
DA Python ID:
project_by_code_groupedThe grouped data area is selected as source of the data series.
Category:
pr_codeThe project code is defined as category of the circle segments.
Number:
amountThe summed up number is defined as share of the circle segments.
Symbol:
pr_codeThe symbol which is applied to the project code data field is defined as symbol for the circle segments.
Action:
action_pr_codeThe button from the source is triggered when you click on a segment.
Label Position:
OutsideThe number specification is displayed outside the chart.
Save.

Configure Tooltip
Objective
To have individual tooltips displayed in the chart.
Procedure
Switch to the Tooltip module by clicking on the
 icon.
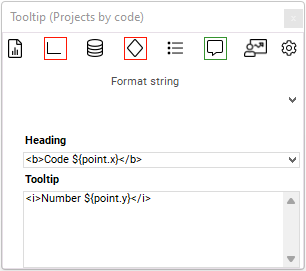
icon.Enter
<b>Code ${point.x}</b>as a value in the Heading field.Enter
<i>Anzahl ${point.y}</i>as a value in the Tooltip field.Save.

Result:

