Open the required chart by clicking on the link in the Chart typefield.
Details
If the chart customizer is opened in the web client, the changes made to the charts are displayed in real-time in the system.
The module currently opened in the chart customizer has a green outline in the toolbar.
If a module is not relevant for the chart type currently opened, it has a red outline.
Note
In order to copy the value of a data field to the respective chart, you have to enter the Python ID of the field. If you want to copy the DF heading instead, you have to prefix the Python ID with an @.
Values which do not contain a prefix or which do not correspond to a valid Python ID from the respective data area are interpreted as fixed strings and automatically receive $ as a prefix.
Example
Create New Chart
Information
In order to be able to create a chart in a module, the module must contain a Button/IronPython data field with "py” DF behavior.
Procedure
Open the module in which you want to create the chart.
If there is only one data field on which a chart can be created, the chart customizer with the Basic Data module will be opened directly.
If there are several data fields which can be used as charts ("py” DF behavior) or if there already are chart configurations in the module, the Create/Edit Charts module will be opened first.
Click on the link in the DI field in the Create new chart area in order to open the chart customizer with the Basic Data module.
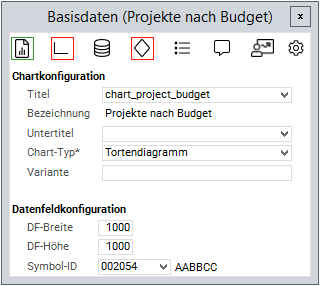
Define the chart attributes in the respective dialog modules of the chart customizer.