Axes MOD009DHE
Access
Customizer → Layout Objects → Charts →Chart Configurations by Work Area → Click on the link of the required chart to open the Chart Customizer→
 Axes
AxesCustomizer → Layout Objects → Charts → Chart Configurations Direct Editing → Click on the link of the required chart to open the Chart Customizer →
AxesOpen the required user module → Click on the button on a chart to open the Chart Customizer →
Axes
Information
In this module you can edit the attributes of the axes of a chart.
Note
The button for opening the Chart Customizer is only displayed for users with customizer rights.
Notes
This module can only be opened for charts with axes (e.g. not for pie charts).
In
barcharts, the X-axis is vertical and the Y-axis is horizontal.
Example
Details
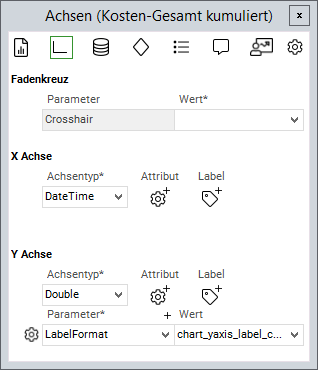
Using the
Crosshairparameter you can define whether a cross-hair pointer is to be displayed when the cursor hovers over the chart.The 0.0 point of axis charts is located at the lower left and the data is added from bottom to top.
Axis type
Information
You can select an axis type for each axis. By default, the following types are available:
Axis type | Description |
|---|---|
| Numeric values |
| Date values |
| Represents numbers on a logarithmic scale |
| Text values |
| Align the date values with the axis values |
Axis parameters
Information
Using the following parameters you can define the axes of a chart in detail.
Axis parameters | Description |
|---|---|
| Minimum value of the axis |
| Maximum value of the axis |
| Defines the unit of the axis steps |
| Defines the steps of a Possible values: Can be combined with |
| Defines how the values are to be displayed at the front and at the back Possible values: |
| Formatting of axis labels Allows for placeholders like, e.g., Here you can also use the Python ID of a data field to have its DF heading displayed. |
| Defines whether the date values in Possible values: |
| Title of the axis Here you can also use the Python ID of a data field to have its DF heading displayed. |
| Width of the grid lines |
| Width of the axis lines |
| Width of the tick marks |
| Defines whether missing data points are to be stuffed on this axis. The value on this axis is determined by the defined Possible values: |
| Value which is used to insert missing data points ( Default values:
|
| Determines whether a today line is to be displayed. Possible values: |
| Determines whether the axis is inverted. If an axis is inverted, the greatest value on the axis is moved closer to the origin and vice versa. Possible values: |
| This parameter serves to choose different layouts for chart axes. |
| Defines the position of the axis labels. Values: |
| Is used for coloring the area in front of the today line in the master milestone status charts. Here, the farb code is entered. |