Open the required user module → Click on the button on a chart → Basic Data
Open the required user module → Click on theStart chart customizing button on a chart data field → Select a chart type in the Select Chart Type module → Basic Data
Information
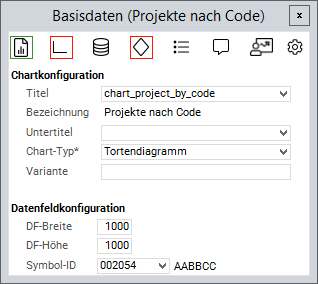
In this module, the descriptive data of a chart, e.g. title or chart type, can be specified and edited.
Example
Details
In the Title and Subtitle fields you can either enter fixed strings or the Python ID of a data field from the chart area.
If a Python ID is entered, the data field heading of the respective data field will be displayed in the language set for the user.
In the Namefield, either the Title or, if available, the data field heading of the title will be displayed.
The name of the Variant is optional and only has to be specified if there are several chart configurations on the data field.
In the Data field configuration area you can adjust DF height and DF width as well as the Symbol ID of the chart data field.