Tooltip MOD009DHI
Access
Customizer → Layout Objects → Charts →Chart Configurations by Work Area → Click on the link of the required chart to open the Chart Customizer→
 Tooltip
Customizer → Layout Objects → Charts → Chart Configurations Direct Editing → Click on the link of the required chart to open the Chart Customizer →
TooltipOpen the required user module → Click on the button on a chart to open the Chart Customizer →
Tooltip
Information
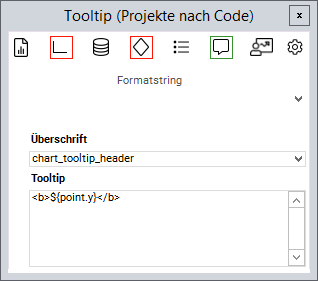
In this module you can configure the tooltip which will be displayed when the cursor hovers over a the data point of a chart.
Note
The button for opening the Chart Customizer is only shown to users with customizer rights.
Details
As a subtitle you can either enter a fixed string or the Python ID of a data field from the chart area.
If a Python ID is entered, the data field heading of the respective data field will be displayed in the language set for the user.
The Tooltip field is the tooltip of the data field on which the chart was created.
The tooltip can thus be translated as well.
Example
Format strings
Via the Format string listbox you can insert different strings in order to format the tooltip as desired.
Code | Explanation |
|---|---|
| Represents the current |
| Represents the current |
| Represents the current |
| Represents the current percentage value |
| Represents the current |
| Formats a text in bold font |
| Formats a text in italic font |
| Inserts a line break |
- Customize Charts
- Tutorial: Chart Customizing
- Charts customizen
- Tutorial: Chart-Customizing
- Chart Customizer
- Chart-Customizer
- Chart Customizer
- Chart Customizer
- Customize Charts
- Chart-Customizer
- Charts customizen
- Chart-Customizer
- Tutorial: Chart Customizing
- Tutorial: Chart-Customizing
- Tutorial: Chart Customizing
- Tutorial: Chart-Customizing
- Tutorial: Chart-Customizing
- Tutorial: Chart Customizing
- Tutorial: Chart-Customizing
- Tutorial: Chart Customizing
- Tutorial: Chart Customizing
- Customize Charts
- Charts customizen
- Tutorial: Chart-Customizing
- Tutorial: Chart Customizing
- Customize Charts
- Tutorial: Chart-Customizing
- Charts customizen
- Tutorial: Chart Customizing
- Customize Charts
- Charts customizen
- Tutorial: Chart-Customizing
- Customize Charts
- Tutorial: Chart Customizing
- Charts customizen
- Tutorial: Chart-Customizing