
Introduction
-
Customizer → Layout Objects → Charts → Chart Configurations by Work Area → Click on the link of the required chart to open the Chart Customizer→

-
Customizer → Layout Objects → Charts → Chart Configurations Direct Editing → Click on the link of the required chart to open the Chart Customizer →
-
Open the required user module → Click on the button on a chart to open the Chart Customizer →
Information
-
In this module you can edit the attributes of the data series of a chart.
-
Depending on the chart type of the opened chart, different data areas are displayed in the module
Note
-
The button for opening the Chart Customizer is only displayed to users with customizer rights.
Notes
-
You can only create one data series per pie chart.
-
By right-clicking in the module and selecting the Configure series-specific markers context menu command, you can insert a custom marker configuration in the Marker module which will only be used for the respective data series.
-
By right-clicking in the module and selecting the Edit data points context menu command, you can configure the data points of a data series individually in the Data Points module.
-
By configuring data points individually, the corresponding settings which have possibly been configured in the Data Series module are overwritten.
-
Example
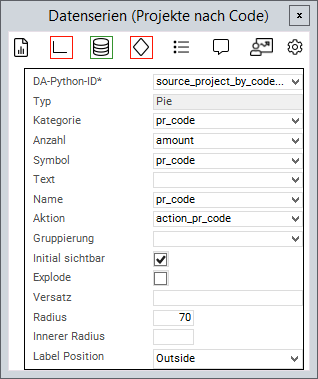
Chart Attributes
Information
-
An attribute is linked to a value from the source area via the Python ID.
-
The value of the data field is then further processed.
-
General Attributes
|
Attribute |
Explanation |
|---|---|
|
|
Python ID of the source data area |
|
|
The chart type in which the data series is to be represented, e.g. |
|
|
Text in the legend |
|
|
Name on the data point |
|
|
Applies the data field color to the data point. Works with traffic lights |
|
|
Defines a data field the action of which will be triggered when the data point is clicked on |
|
|
The values of the series are grouped by the value in this data field |
|
|
When deactivated, the values of this series will not be displayed initially and must be activated via the legend |
|
|
Point on the X-axis at which the data point is to be set |
|
|
Point on the Y-axis at which the data point is to be set |
|
|
ID of the PLANTA symbol which is used to determine the text font. Overrides |
|
|
Determines whether the value labels are displayed in the chart itself, i.e., on the data points or circle segments. Default value: active. If the attribute is deactivated, the value can be shown in the legend via This setting applies independently of |
|
|
Template for the label of the data series in the legend. The same placeholders as in tooltips are available, such as If the attribute stays empty, the default label appears. For axis charts the name of the data series and for pie charts the category of the circular segment. |
|
|
Maximum length of the label in characters |
|
|
This parameter is used to configure how 0 values are taken into account and how they are displayed in the chart. Possible settings:
Zero value applies to all chart types except process, risk, and opportunity. The |
Attributes for Bar/Gantt Charts
|
Attribute |
Explanation |
|---|---|
|
|
Width of the columns or bars as a share of the available width, value between 0 and 1. The smaller the value, the bigger the distance between the columns. Default value: 0.7. The value of the first data series of the chart applies. As of DB 27, this attribute replaces the removed |
|
|
Data field with image output whose image is displayed as a small round icon next to the category label of the respective bar. If the attribute is left empty, no icons are displayed and the layout remains unchanged. A category whose data field does not contain an image receives neither an icon nor a placeholder. Currently only applies to horizontal bar charts. |
Attributes for Pie Charts
|
Attribute |
Explanation |
|---|---|
|
|
Name of the circular segment |
|
|
Fraction value of the circular segment |
|
|
When activated, the circular segments can be detached and inserted again by clicking |
|
|
Defines the size of the segment radius in percent (in relation to the chart size) |
|
|
Converts the pie chart into a donut diagram by releasing a percentage inside the diagram |
|
|
Text that is displayed in the middle of a donut chart above the value. In addition to fixed text, the Python ID of a data field can be used to display its value.
If the attribute is left empty, the entire label in the center, including the value, is omitted. The attribute only takes effect if |
|
|
Value displayed in the center of a donut chart below
If the attribute is left empty, the chart displays the sum of all data points. The attribute only takes effect if |
|
|
Determines whether the label in the middle of the donut chart ( |
|
|
Font size of the label in the middle of the donut chart ( |
|
|
Configures whether a text field with the number of circular segments is displayed. Possible values: |
|
|
Font size of the label in pixels (default = 12) |
Note
-
As of DB 27, the attributes
Offset,Label Overflow,Label Text Wrap, andLabel Widthare no longer used. The label length is limited in characters viaLabel Maximum Length. The values of the removed attributes are not carried over during the update.
Attribute for range charts
|
Attribute |
Explanation |
|---|---|
|
|
The lower value of the data point |
|
|
The upper value of the data point |
Attributes for Scatter Plots
|
Attribute |
Explanation |
|---|---|
|
|
Is used for defining the frame width of the empty rhombs in master milestone status charts (scatter plots). Default is 0 (no frame). Values from 0 provide a frame. |
Attribute for Bubble Charts
|
Attribute |
Explanation |
|---|---|
|
|
Determines the size of the bubble |
|
|
Defines whether the size is to be inverted in bubble data series. When activated, greater values will be represented by smaller bubbles. |
|
|
The minimum radius of a bubble |
|
|
The maximum radius of a bubble |
- Tutorial: Chart-Customizing
- Tutorial: Chart Customizing
- Chart-Customizer
- Tutorial: Chart Customizing
- Tutorial: Chart Customizing
- Chart-Customizer
- Tutorial: Chart Customizing
- Tutorial: Chart Customizing
- Tutorial: Chart Customizing
- Charts customizen
- Tutorial: Chart Customizing
- Customize Charts
- Tutorial: Chart-Customizing
- Tutorial: Chart Customizing
- Tutorial: Chart-Customizing