
Introduction
-
Customizer → Layout Objects → Charts → Chart Configurations by Work Area → Click on the link of the required chart to open the Chart Customizer→

-
Customizer → Layout Objects → Charts → Chart Configurations Direct Editing → Click on the link of the required chart to open the Chart Customizer →
-
Open the required user module → Click on the button on a chart to open the Chart Customizer →
Information
-
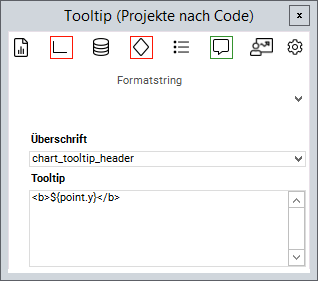
In this module you can configure the tooltip which will be displayed when the cursor hovers over a chart data point.
Note
-
The button for opening the Chart Customizer is only displayed to users with customizer rights.
Details
-
As a subtitle you can either enter a fixed string or the Python ID of a data field from the chart area.
-
If a Python ID is entered, the data field heading of the respective data field will be displayed in the language set for the user.
-
-
The Tooltip field is the tooltip of the data field on which the chart was created.
-
The tooltip can thus be translated as well.
-
Example
Format strings
-
Via the Format string listbox you can insert different strings in order to format the tooltip as desired.
|
Code |
Explanation |
|---|---|
|
|
Represents the current |
|
|
Represents the current |
|
|
Represents the current |
|
|
Represents the current percentage value |
|
|
Represents the current |
|
|
Formats a text in bold font |
|
|
Formats a text in italic font |
|
|
Inserts a line break |
- Tutorial: Chart-Customizing
- Tutorial: Chart Customizing
- Chart-Customizer
- Tutorial: Chart Customizing
- Tutorial: Chart Customizing
- Chart-Customizer
- Tutorial: Chart Customizing
- Tutorial: Chart Customizing
- Tutorial: Chart Customizing
- Charts customizen
- Tutorial: Chart Customizing
- Customize Charts
- Tutorial: Chart-Customizing
- Tutorial: Chart Customizing
- Tutorial: Chart-Customizing
- Customize Charts
- Tutorial: Chart-Customizing
- Charts customizen
- Tutorial: Chart-Customizing
- Tutorial: Chart-Customizing
- Chart Customizer
- Chart-Customizer
- Customize Charts
- Tutorial: Chart-Customizing
- Tutorial: Chart Customizing
- Customize Charts
- Charts customizen
- Charts customizen
- Customize Charts
- Tutorial: Chart-Customizing
- Charts customizen
- Charts customizen
- Tutorial: Chart-Customizing
- Customize Charts
- Charts customizen
- Chart Customizer
- Customize Charts
- Tutorial: Chart Customizing
- Chart Customizer
- Tutorial: Chart-Customizing