
Access
-
Customizer → Layout Objects → Charts → Chart Configurations by Work Area → Click on the link of the required chart to open the Chart Customizer→

-
Customizer → Layout Objects → Charts → Chart Configurations Direct Editing → Click on the link of the required chart to open the Chart Customizer →
-
Open the required user module → Click on the button on a chart to open the Chart Customizer →
For information
-
In this module you can edit the attributes of the axes of a chart.
Note
-
The button for opening the Chart Customizer is only displayed to users with customizer rights.
Notes
-
This module can only be opened for charts with axes (e.g. not for pie charts).
-
In
barcharts, the X-axis is vertical and the Y-axis is horizontal.
Example
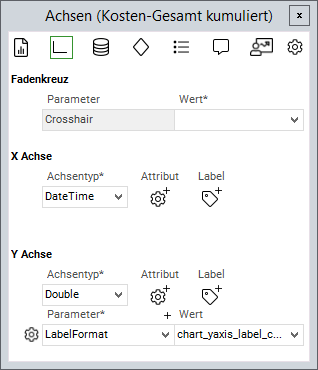
Details
-
Using the
Crosshairparameter you can define whether a cross-hair pointer is to be displayed when the cursor hovers over the chart. -
The 0.0 point of axis charts is located at the lower left and the data is added from bottom to top.
Axis type
Information
-
You can select an axis type for each axis. By default, the following types are available:
|
Axis type |
Description |
|---|---|
|
|
Numeric values |
|
|
Date values |
|
|
Represents numbers on a logarithmic scale |
|
|
Text values |
|
|
Align the date values with the axis values |
Axis parameters
Information
-
Using the following parameters you can define the axes of a chart in detail.
|
Axis parameters |
Description |
|---|---|
|
|
Minimum value of the axis |
|
|
Maximum value of the axis |
|
|
Defines the unit of the axis steps |
|
|
Defines the steps of a Possible values: Can be combined with |
|
|
Defines how the values are to be displayed at the front and at the back Possible values: |
|
|
Formatting of axis labels. Allows for placeholders like, e.g., Here you can also use the Python ID of a data field to have its DF heading displayed. |
|
|
Defines whether the date values in Possible values: |
|
|
Title of the axis Here you can also use the Python ID of a data field to have its DF heading displayed. |
|
|
Width of the grid lines |
|
|
Width of the axis lines |
|
|
Width of the tick marks |
|
|
Defines whether missing data points are to be stuffed on this axis The value on this axis is determined by the defined Possible values: |
|
|
Value which is used to insert missing data points ( Default values:
|
|
|
Determines whether a today line is to be displayed Possible values: |
|
|
Determines whether the axis is inverted If an axis is inverted, the greatest value on the axis is moved closer to the origin and vice versa. Possible values: |
|
|
This parameter serves to choose different layouts for chart axes. Possible values are, e.g., Rotate45 (rotate axis labeling by 45°), Rotate90 (rotate by 90°) or Hide (hide axis). |
|
|
Defines the position of the axis labels Values: |
|
|
Is used for coloring the area in front of the today line in the master milestone status charts. Here, the farb code is entered. |
- Tutorial: Chart-Customizing
- Tutorial: Chart Customizing
- Chart-Customizer
- Tutorial: Chart Customizing
- Tutorial: Chart Customizing
- Chart-Customizer
- Tutorial: Chart Customizing
- Tutorial: Chart Customizing
- Charts customizen
- Tutorial: Chart Customizing
- Customize Charts
- Tutorial: Chart-Customizing
- Tutorial: Chart Customizing
- Tutorial: Chart-Customizing
- Customize Charts